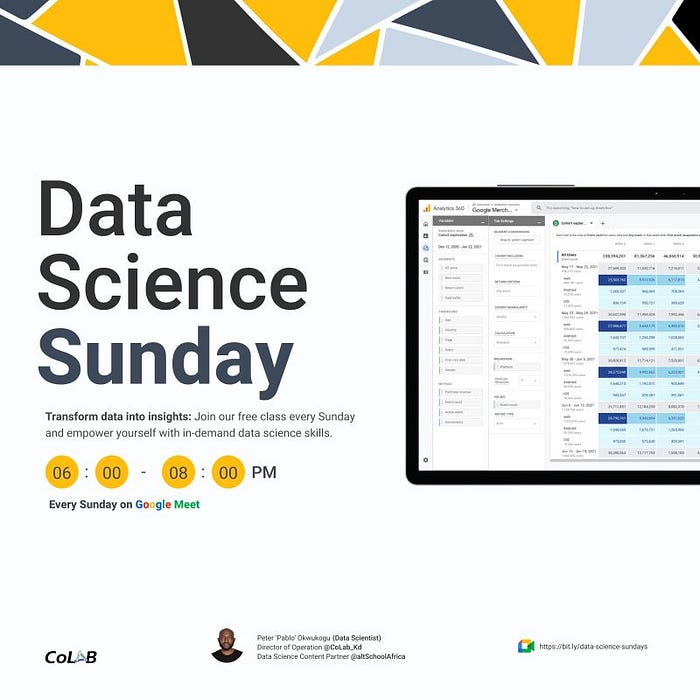
Data Science Sunday Episode 10 for 2024
Statistics and Data Analysis.
I am a Product Manager from Nigeria, taking one day at a TIME and Documenting my Product Journey.
Introduction
Thanks to Everyone at Colab kaduna Data Science Sundays, most especially the convener Sanusi, and the facilitator Peter O.
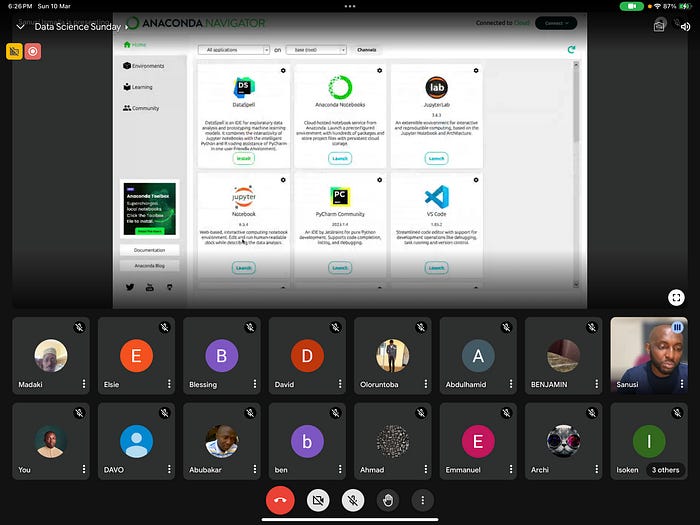
It was a moment we had Data scientists from across the globe, from Africa, Asia, South America etc all in one call.
This was the 10th meet for individuals interested in learning more about Python from scratch, Grasp key Data Science , Data Analysis Concepts.
We engaged in Hands-on Coding Exercises, Participated in Q&A Sessions, Networked with like-minded individuals.
We started off with why the Data Science Sundays is important and key elements of learning Data science for impact, Learn Python, Why Python, Industry Standards.
We discussed at length on some of the reasons why the benefits of data science can not be ignored. data Analysis, Python and Statistics.
We were reminded to organize and structure our learning.

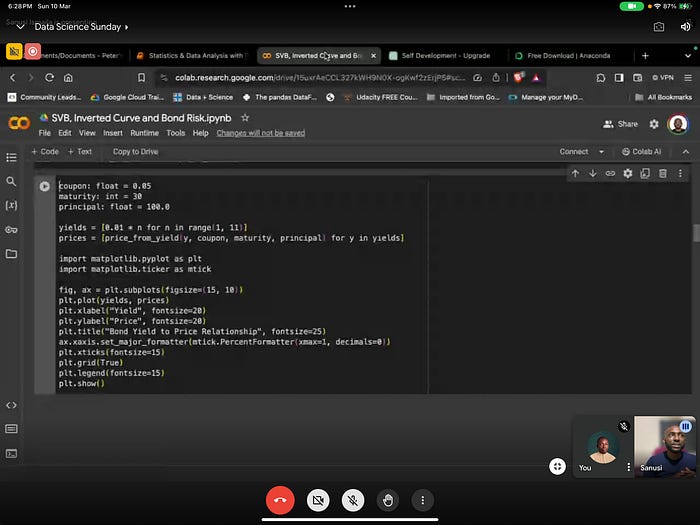
Hands-on Coding Exercises
We were taken through Google Colaboratory, Jupyter Notebook.
We had a shallow test, and went through Python Docs and Glossary.
We Engaged in Hands-on Coding Exercises, Participate in Q&A Sessions, Networked with like-minded individuals.
We had the opportunity to be given links to resources on Data Science, Statistics , Anaconda , and Python Basics on YouTube ,and Links to previous episodes.
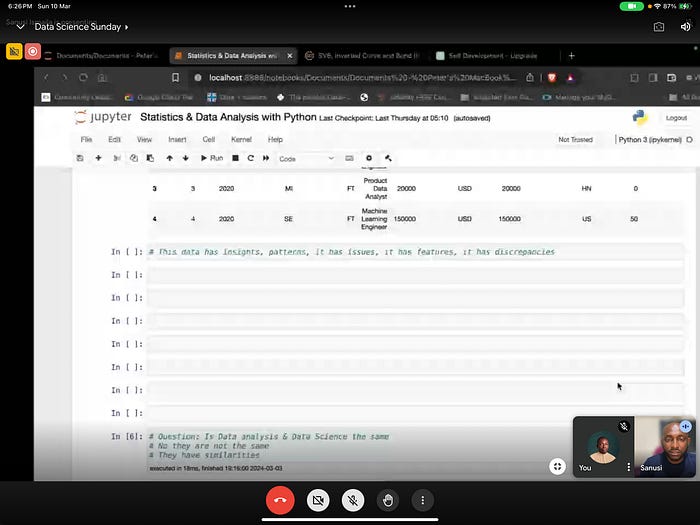
This was second in the series with Statistics and Data Analysis.
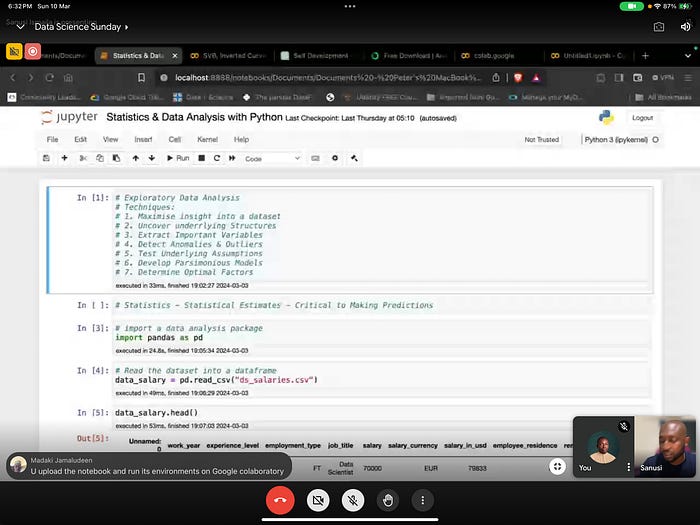
We were reminded that statistics — Statistical Estimates — Are critical to making decisions.
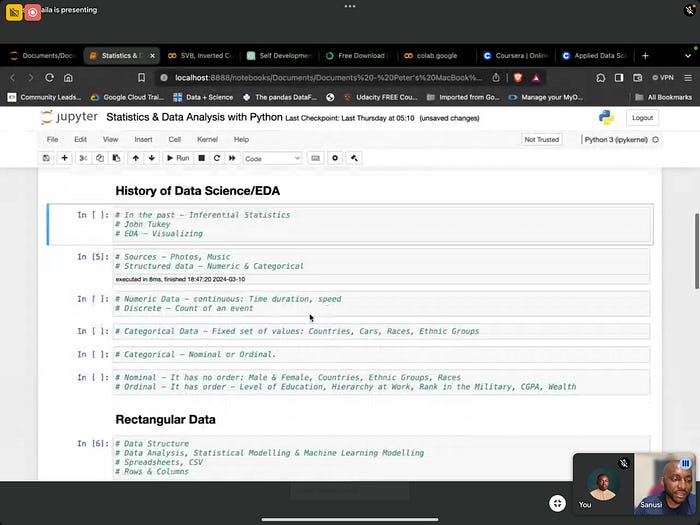
History of Data Science / EDA
In the past business and critical decisions were made by inferential statistics.
John Tukey :
John Wilder Tukey was an American mathematician and statistician, best known for the development of the fast Fourier Transform algorithm and box plot. The Tukey range test, the Tukey lambda distribution, the Tukey test of additivity, and the Teichmüller — Tukey lemma all bear his name.
EDA — Visualizing works with structured data. Sources of unstructured Data include photographs and Music files.
Structured Data are Numeric and Categorical
Numeric Data — continuous: Time duration, Speed.
Discrete Data — Count of an event
Categorical Data — Fixed set of values examples include countries, cars, races, ethnic groups.
Nominal Data — It has order : Male and female, Countries, Ethnic Groups, Races.
Ordinal Data — It has Order e.g Level of Education, Hierarchy at Work, Rank in the Military, CGPA, Wealth .
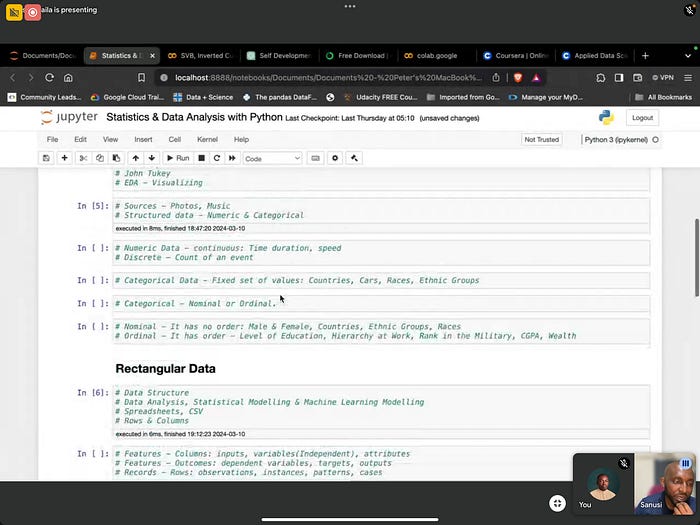
Rectangular Data
We discussed under rectangular data its :
Data Structure
Data Analysis, Statistical Modeling and Machine Learning Modeling.
Rows and Columns
Features — Columns: inputs, variables (Independent), attributes
Features — Outcomes: dependent variables, targets, outputs
Records — Rows: observations, instances, patterns, cases .
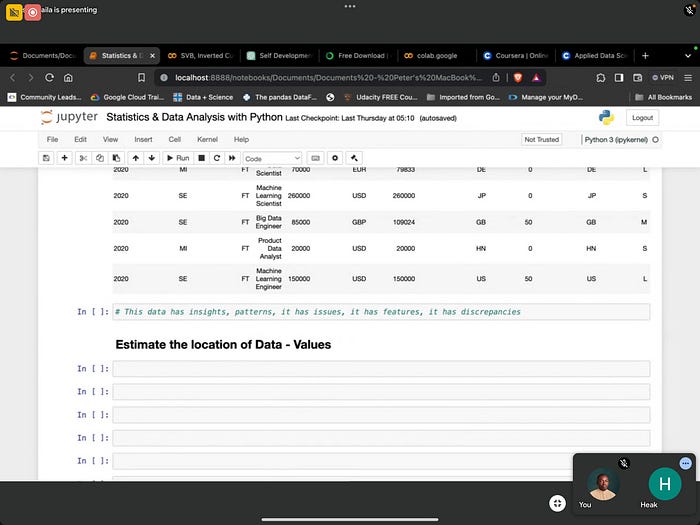
In the Data set used, it showed the data had insights, patterns, it had issues, it had features, it had discrepancies.
Conclusion
In conclusion, EDA plays a crucial role in guiding subsequent analysis steps, informing modeling decisions, and ensuring the validity and reliability of the analytical results.
You can be part of the next episode , which is episode 11, The registration link to the. meeting. 📺 is below ⬇️
https://forms.gle/kSc6nqoQGiNNsRN18